How to access Hi-C map from .gcmap file?
.gcmap is a HDF5 format file.
Note
Following example needs *.ccmap file, generated in previous tutorial.
At first, we import modules:
- gcMapExplorer.lib
- numpy for statistics
- matplotlib for plotting
In [1]:
import gcMapExplorer.lib as gmlib
import numpy as np
import matplotlib.pyplot as plt

# To show inline plots
%matplotlib inline
plt.style.use('ggplot')              # Theme for plotting
Load a .gcmap file
- At first load a map of chromosome from gcmap file using GCMAP class.
- Also, load it as ccmap to compare.
In [2]:
filename = 'output/CooMatrix/rawObserved_100kb.gcmap'

# Load through GCMAP class
gcmap = gmlib.gcmap.GCMAP(filename, mapName='chr21')

# Load as a CCMAP class
ccmap = gmlib.gcmap.loadGCMapAsCCMap(filename, mapName='chr21')
Print some properties of Hi-C data
In [3]:
for key in gcmap.__dict__:
    print(key, ' : ', gcmap.__dict__[key])
hdf5  :  <HDF5 file "rawObserved_100kb.gcmap" (mode r+)>
title  :  chr21_vs_chr21
mapType  :  intra
matrix  :  <HDF5 dataset "100kb": shape (482, 482), type "<f4">
ylabel  :  chr21
binsize  :  100000
shape  :  (482, 482)
resolution  :  100kb
yticks  :  [0, 48200000]
xticks  :  [0, 48200000]
bLog  :  False
bNoData  :  None
mapNameList  :  None
binsizes  :  [100000]
dtype  :  float32
finestResolution  :  100kb
xlabel  :  chr21
minvalue  :  1.0
maxvalue  :  87922.0
fileOpened  :  True
groupName  :  chr21
Reading contact map
Contact matrix is available as gcmap.matrix as similar to that of
ccmap.matrix.
In [4]:
print(gcmap.matrix[:])

ccmap.make_readable()
print(ccmap.matrix)
[[     0.      0.      0. ...,      0.      0.      0.]
 [     0.      0.      0. ...,      0.      0.      0.]
 [     0.      0.      0. ...,      0.      0.      0.]
 ...,
 [     0.      0.      0. ...,  45925.  18365.    125.]
 [     0.      0.      0. ...,  18365.  45513.    523.]
 [     0.      0.      0. ...,    125.    523.    135.]]
As can be seen in the above plot, sum of rows/columns are approximately one. It means that the matrix is balanced.
Using numpy modules
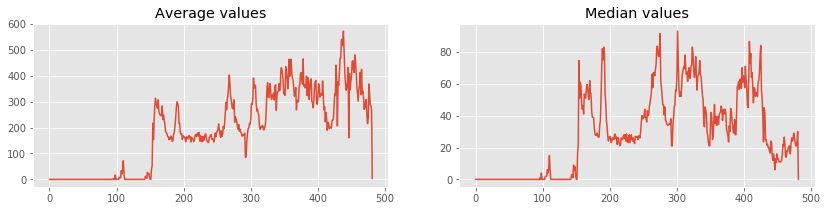
Lets plot average and median of each rows using numpy.mean and numpy.median.
In [5]:
averages = np.mean(gcmap.matrix, axis = 1)            # Calculating mean using numpy.mean
medians = np.median(gcmap.matrix, axis = 0)           # Calculating median using numpy.median

# Plot the values for visual representations
fig = plt.figure(figsize=(14,3))                               # Figure size

ax1 = fig.add_subplot(1,2,1)                                   # Axes first plot
ax1.set_title('Average values')                                 # Title first plot
ax1.get_yaxis().get_major_formatter().set_useOffset(False)     # Prevent ticks auto-formatting

ax2 = fig.add_subplot(1,2,2)                                   # Axes second plot
ax2.set_title('Median values')
ax2.get_yaxis().get_major_formatter().set_useOffset(False)

# in below both plots, x-axis is index from original matrix to preserve original location
ax1.plot(averages)   # Plot in first axes
ax2.plot(medians)    # Plot in second axes

plt.show()
Execution Time Comparison between np.ndarray, ccmap.matrix and gcmap.matrix
In [6]:
cmap = np.asarray( ccmap.matrix[:] )

print('cmap Type:', type(cmap))
print('ccmap Type:', type(ccmap.matrix))
print('gcmap Type:', type(gcmap.matrix))

print(' ')

%timeit np.sum(gcmap.matrix, axis = 0)             # Sum along row using numpy.sum
%timeit np.sum(ccmap.matrix, axis = 0)             # Sum along row using numpy.sum
%timeit np.sum(cmap, axis = 0)             # Sum along row using numpy.sum

print(' ')

%timeit np.sum(gcmap.matrix, axis = 1)             # Sum along column using numpy.sum
%timeit np.sum(ccmap.matrix, axis = 1)             # Sum along column using numpy.sum
%timeit np.sum(cmap, axis = 1)             # Sum along column using numpy.sum

print(' ')

%timeit np.mean(gcmap.matrix, axis = 1)            # Calculating mean using numpy.mean
%timeit np.mean(ccmap.matrix, axis = 1)            # Calculating mean using numpy.mean
%timeit np.mean(cmap, axis = 1)            # Calculating mean using numpy.mean

print(' ')

%timeit np.median(gcmap.matrix, axis = 0)           # Calculating median using numpy.median
%timeit np.median(ccmap.matrix, axis = 0)           # Calculating median using numpy.median
%timeit np.median(cmap, axis = 0)           # Calculating median using numpy.median

del ccmap
cmap Type: <class 'numpy.ndarray'>
ccmap Type: <class 'numpy.core.memmap.memmap'>
gcmap Type: <class 'h5py._hl.dataset.Dataset'>

1000 loops, best of 3: 272 µs per loop
The slowest run took 5.28 times longer than the fastest. This could mean that an intermediate result is being cached.
10000 loops, best of 3: 41.2 µs per loop
10000 loops, best of 3: 39.2 µs per loop

1000 loops, best of 3: 307 µs per loop
10000 loops, best of 3: 71.8 µs per loop
10000 loops, best of 3: 69.9 µs per loop

1000 loops, best of 3: 315 µs per loop
10000 loops, best of 3: 76.7 µs per loop
10000 loops, best of 3: 73.9 µs per loop

1000 loops, best of 3: 1.64 ms per loop
1000 loops, best of 3: 1.4 ms per loop
1000 loops, best of 3: 1.38 ms per loop
In [ ]: